
Put yourself in the position of tax authorities. There is limited time and resources available for tax audit such that risk assessment tools are used to identify high risk taxpayers and arrangements. Country-by-Country (“CbC”) reports, in combination with other sources of information, provide a useful source of global taxpayer data in standardized format that can be added to existing risk assessment tools. With CbC data now publicly available, taxpayers can use the Aibidia Transfer Pricing Cloud to compare their group data to their peers, enabling the swift identification of risk areas and proactively commenting in the submitted reports.
Basic Framework for Assessing Risk with CbC Data
CbC data is a perfect starting point for conducting a tax risk assessment of multinational enterprises. The data presents a harmonized global picture of a group’s country-level financials and entity-level business activities. CbC reports are submitted in a standardized format on a yearly basis and the data quality is relatively good because information is typically compiled centrally by the group’s parent. Over time, we can expect tax examiners to develop a clear understanding of which financial data thresholds, activity constellations, and manually-added notes imply potential base erosion and profit shifting (“BEPS”) activities.
Risk associated with BEPS activities can come from recurring and one-off transactions, both of which can skew financial and business activity data detectable in a CbC report. Tax authorities will want to establish a comparison of:
- Financials and activity profiles in different jurisdictions within the same group;
- Financials and activity profiles of one group with another group in a similar sector; and
- Financials and activity profiles for the same group over time.
In this article, we first describe publicly available CbC benchmark data and then present some of the standard tax risk indicators that tax authorities use to conduct a risk analysis.
Accessing OECD Benchmark Data
In 2019, almost 100 tax jurisdictions have automatically exchanged tax data (26 have exchanged CbC report data), covering 84 million financial accounts and a total asset base of EUR 10 trillion. In July 2020, the OECD made available 2016 data, accessible on http://oe.cd/corporate-tax-stats in the section for anonymized and aggregated CbC reporting statistics. Note the following characteristics of the data:
- CbC reports have been received from the following jurisdictions: Australia, Austria, Belgium, Bermuda, Brazil, Canada, Chile, China, Denmark, Finland, France, India, Indonesia, Ireland, Italy, Japan, Korea, Luxembourg, Mexico, Netherlands, Norway, Poland, Singapore, Slovenia, South Africa, Sweden and United States.
- Data is available on an aggregate and average basis.
- Measurement unit is in US Dollar.
- Updates to the data are available every year.
The data is subject to a number of data limitations (https://www.oecd.org/tax/tax-policy/anonymised-and-aggregated-cbcr-statistics-disclaimer.pdf). For example, possible double counting of profits may result in effective tax rates biased downwards and profitability ratios and returns to capital biased upwards.
Keeping the above points in mind, we present possible ways of how to prepare a high-level benchmark for your group’s CbC data.
Comparing Your Group Against an Average Group
Since taxpayers can only view CbC data on an aggregate level for a country, a sector-level comparison is not possible. The fact that certain countries did not provide any CbC data provides an additional restriction. In this case, a similar economy is the next best way to prepare a high-level comparison.
After you have selected CbC data for your own country or a broadly comparable country, you can download and import the chosen data into our Aibidia CbC module. You can then use the analytics tool within the Aibidia CbC module to analyze average statistics and compare them to your own group.
Let us now look at some of the most common tax risk indicators. Note that you can use average group data not only for a comparison of your group’s data against the average group’s data for a particular jurisdiction but also for a comparison of jurisdictional differences within your own group.
High or low tax risk indicators must be understood in the context of a comparison of one jurisdiction to another within the same group, of one jurisdiction to the group as a whole, of one group to another comparable group, or of observations of one group over time.
Tax Risk Indicators
Footprint
Identify jurisdictions with the largest footprint (e.g. revenue or number of employees) within your group and compare this against the business activities of average groups.
You can use benchmark data to view whether average groups have also been active in your jurisdictions.

Danish CbC Data (imported into Aibidia Transfer Pricing Cloud)
Danish CbC Data (imported into Aibidia Transfer Pricing Cloud)
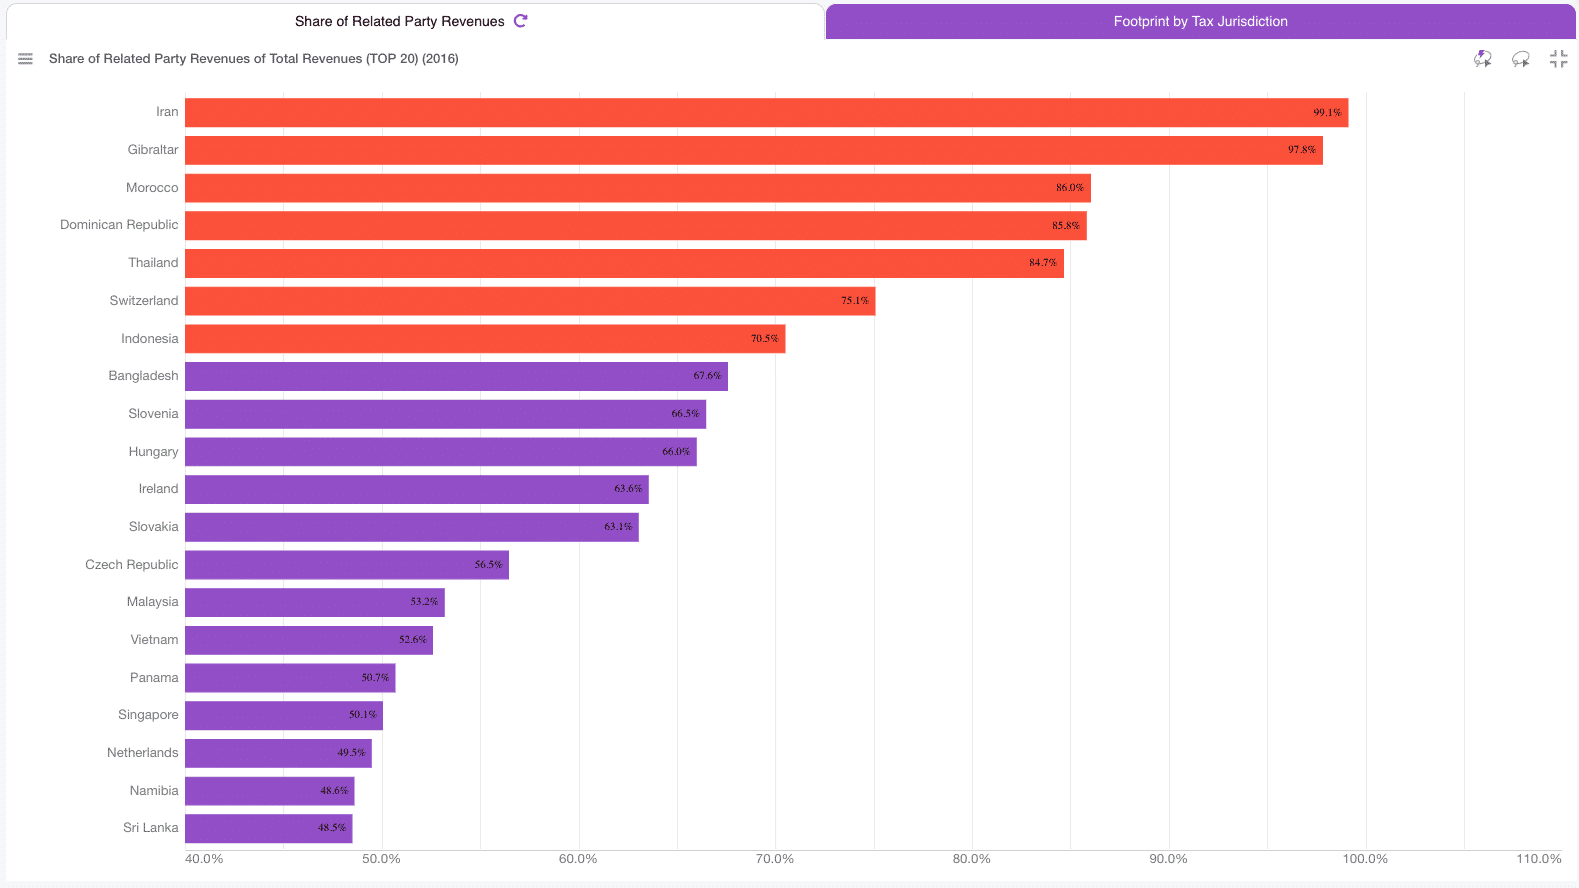
Share of related party revenue
Analyze the value or portion of related party revenue by jurisdiction to prepare for increased scrutiny of affiliates whose share is high and subject to transfer pricing policy.
See what portion of revenues your average peers show in corresponding jurisdictions.
Financial ratios
Compare within the group, to your peers, or over time:
- Effective tax rates against profit margins, revenue, or profit rates
- Identify jurisdictions with high profit margins — i.e. profit before tax / total revenues
- Identify jurisdictions with low effective tax rates — i.e. income tax accrued / profit before tax
- Identify jurisdiction with high revenue or profit rates — i.e. revenue or profits before tax per unit of economic activity, such as number of employees or tangible assets.

Business activity
Take a closer look at the geographical distribution of your group’s activities as entered into Table 2 of the CbC report.

Tax paid analysis
Compare your group’s discrepancy between income tax paid (on a cash basis) and income tax accrued to the level of discrepancy observed in other groups.

Danish CbC Data (imported into Aibidia Transfer Pricing Cloud)
There are a number of reasons the results of any comparison should be approached with caution. For example, group affiliates across jurisdictions can be of different sizes, operate in different markets, and or engage in varying activities. When comparing your group with peers, commercial reasons, such as strategy and business models, may go some way to explaining discrepancies in data.Connect with Aibidia to demo our CbC analytics tool and obtain the undeniable strategic benefits of group comparison.
Sources
Handbook on Effective Tax Risk Assessment, OECD 2017
stats.oecd.org


.png)
.png)

.png)

.png)
.png)


.svg)

