
The transactional net margin method (TNMM) tests whether a controlled transaction is at arm's length by comparing the net profit a taxpayer realizes from that transaction, relative to an appropriate base such as costs, sales, or assets, against the net margins earned by comparable independent companies. It is one of the five transfer pricing methods recognized in the OECD Transfer Pricing Guidelines, and the most widely applied of the five, because reliable net margin data on independent companies is far easier to source than the price or gross margin data the other methods require.
TNMM belongs to the family of transactional profit methods, alongside the profit split method. The other three OECD methods, comparable uncontrolled price, resale price, and cost plus, are traditional transaction methods that test prices or gross margins directly. Because TNMM operates similarly to the resale price and cost plus methods, it must be applied with the same consistency: the tested party's net profit indicator should ideally be established by reference to internal comparables (the same taxpayer's comparable uncontrolled transactions) before external comparables (independent enterprises) are used as a guide, and a functional analysis is required to establish comparability either way.
How does TNMM work?
- Select the tested party. Choose the entity in the transaction with the simpler functional profile, typically a distributor, contract manufacturer, or service provider, since simpler entities are easier to benchmark against a larger pool of independent comparables.
- Choose a profit level indicator (PLI). The PLI expresses net profit relative to a relevant base: operating margin for distributors, net cost-plus or full-cost markup for service providers and manufacturers, return on assets for capital-intensive operations, or the Berry ratio in narrower circumstances.
- Build a set of comparables. A benchmarking study identifies independent companies performing similar functions, bearing similar risks, and using similar assets, typically drawn from commercial databases and refined through quantitative screens and manual review.
- Establish the arm's length range. The comparables' net margins form a range how that range is constructed differs by jurisdiction. If the tested party's result falls within it, the pricing is supportable; if not, an adjustment is generally required.
TNMM is applied on a transaction-by-transaction basis in principle, though product or transaction groupings are permitted where aggregation doesn't impair comparability.
Worked example - internal comparable: A German manufacturer sells products to both related distributors within its group and unrelated external distributors, performing the same functions and bearing the same risks in both cases. Because internal comparable transactions exist, the group splits the manufacturing P&L into related and unrelated-party segments and compares the net profit earned on each, the more reliable route under the Guidelines' preference for internal over external comparables.
Worked example - external comparable: A Mexican distribution entity buys raw material solely from its French parent and resells it in the LATAM market. No internal comparable exists, so the group tests the Mexican entity's operating margin against a benchmarking study of independent LATAM distributors performing comparable functions.
What is a "tested party" in TNMM?
The tested party is the entity whose profitability is analyzed, ordinarily the simpler of the two parties to the transaction, because it has fewer functions, risks, and assets to control for, and a larger population of independent comparables exists against which to benchmark it. In a manufacturer-distributor transaction, the distributor is typically the tested party.
What profit level indicators does TNMM use, and how should they be chosen?
- Operating margin (operating profit over sales): the standard choice for distributors and sales agents.
- Net cost-plus or full-cost markup: suited to service providers and manufacturers, where the value driver is cost incurred rather than revenue generated.
- Return on assets: fits capital-intensive operations where profitability tracks the asset base rather than turnover.
- Berry ratio (gross profit over operating expenses): reached for more often than the Guidelines support. It's appropriate only where the tested party's value is closely correlated with its operating expenses rather than its sales or the value of goods handled, it performs no significant intermediary function carrying material inventory or resale-price risk, and its asset base doesn't diverge materially from the comparables'. Applying a Berry ratio outside those conditions produces a number that looks defensible on paper and rarely survives a tax authority's benchmarking review.
PLI choice should follow the tested party's functional profile, not the base that happens to produce the most comfortable result. A reviewer should be able to see the functional rationale before seeing the number.
What comparability adjustments does TNMM typically require?
The most common is a working capital adjustment: two functionally identical entities can report different net margins purely because one carries more receivables, payables, or inventory financing than the other. The OECD Guidelines support adjusting for this where the difference is material and reliably quantifiable, typically by pricing the differential in net operating assets between the tested party and each comparable at an appropriate interest rate, rather than asserting a qualitative adjustment. Adjustments should be applied consistently, before the result is known, not selectively wherever they happen to move the number in the tested party's favor.
How is the arm's length range constructed?
This is where OECD and US practice diverge, and it matters for any group documenting the same transaction under both frameworks. Under the OECD Guidelines, the interquartile range is the conventional tool for narrowing a comparable set where comparability, while acceptable, isn't exact (which is most of the time). Under the US regulations governing the comparable profits method (Treas. Reg. §1.482-5, applying the arm's length range standard in §1.482-1(e)(2)), the full range of results can be used where the comparables meet a high standard of comparability; the interquartile range is specifically the mechanism for compensating for lower comparability, not the default narrowing step.
Two related practices matter at review stage: testing across multiple years rather than a single year, since PLIs are noisy and one weak year shouldn't drive the conclusion; and applying a consistent, functionally justified policy on loss-making comparables rather than excluding them whenever they're inconvenient,. the Guidelines support exclusion on functional or economic grounds, not simply because a comparable lost money.
What are the advantages of TNMM?
- Tolerant of product differences. Comparables selling different products can still be reliable if their functions and risks match.
- Less sensitive to accounting inconsistencies. Differences in cost classification between companies wash out at the operating-profit level.
- Available at scale. Commercial databases hold audited financials for thousands of independent companies, making defensible comparable sets feasible across jurisdictions.
- Familiar to tax authorities. A well-documented TNMM analysis with a sound benchmarking study is a credible, well-understood position in almost every OECD-adherent jurisdiction.
What are the limitations of TNMM?
- One-sided. TNMM tests only the tested party's profitability and says nothing about whether the counterparty's residual profit is reasonable.
- Sensitive to non-transfer-pricing factors. Management efficiency, market position, cost structure, and the business cycle all move net margins independently of pricing.
- Breaks down for two-sided value chains. Where both parties make unique, valuable contributions, shared ownership of intangibles, or genuinely shared economically significant risk, no independent comparable can capture the arrangement, and the profit split method is the better fit.
- Only as reliable as the functional analysis behind it. Comparability adjustments can address specific differences, but the quality of a TNMM analysis ultimately rests on the rigor of the functional analysis and the benchmarking study, not the arithmetic of the range.
How does TNMM compare to other transfer pricing methods?
TNMM tests profitability rather than price. The comparable uncontrolled price method tests individual transaction prices directly and demands near-identical transactions between independent parties (data that rarely exists). The cost plus and resale price methods test gross margins, which depend on consistent cost classification across entities; TNMM's net-margin focus is more tolerant of that inconsistency. Where both parties to a transaction hold valuable, unique contributions, profit split, not TNMM, is the appropriate method.
TNMM versus the US comparable profits method (CPM): the US Section 482 regulations don't use the term "TNMM", the analogous method is CPM, and the mechanics largely converge (a profit level indicator, an arm's length range, a preference for the simpler tested party). The frameworks diverge in ways that matter for groups documenting the same transaction under both: the US applies a best method rule rather than a strict method hierarchy, so CPM must be affirmatively shown to be the most reliable method available; US benchmarking searches also tend to draw on narrower, US- or NAFTA-region comparable sets where an OECD-oriented study typically defaults to a pan-regional set, a scope difference that needs a documented rationale rather than an assumption that one study serves both purposes.
What types of transactions are best suited to TNMM?
- The provision of services, such as marketing support, contract R&D, or IT support.
- The distribution of finished goods, particularly by a limited-risk distributor.
- Transactions where only one party makes unique and valuable contributions. Product comparability is the least stringent requirement of any method; the emphasis falls on the similarity of functions, assets, and risks between the controlled and uncontrolled transactions.
How does TNMM interact with Amount B and Pillar Two?
Amount B, finalized by the OECD in February 2024 and supported by pricing tools updated through 2026, gives in-scope baseline marketing and distribution activities a simplified, formula-based return using a pricing matrix rather than a bespoke benchmarking study. It's elective in most adopting jurisdictions and mandatory in a defined list of covered jurisdictions when a counterparty elects it. For routine, low-risk distributors, it's worth checking scope against current OECD guidance before defaulting to a full TNMM study every year.
Pillar Two doesn't replace TNMM, but the two increasingly touch. GloBE income is a financial-accounting construct, not the TNMM profit level indicator, but a transfer pricing true-up made after year-end can shift covered taxes and GloBE income in the same period, with knock-on effects for the effective tax rate calculation. The transitional CbCR safe harbour also leans on a routine-profits concept that sits close to the margin range a TNMM benchmarking study already produces, meaning the benchmarking work done for transfer pricing purposes now often has a second, Pillar Two audience inside the same organization.
How can companies ensure compliance when applying TNMM?
- Perform rigorous, functionally grounded benchmarking rather than defaulting to the prior year's comparable set unchanged.
- Document the selection rationale for the tested party, the PLI, and any comparability adjustments, not just the resulting range.
- Monitor tested-party margins against benchmarked ranges throughout the year, rather than discovering drift at year-end. A distributor targeted at a 3% operating margin that lands at 6% by year-end isn't only a documentation gap, it's a true-up that gets harder to explain the longer margins go unmonitored, and one that can ripple into a Pillar Two effective tax rate calculation before anyone outside the transfer pricing team notices.
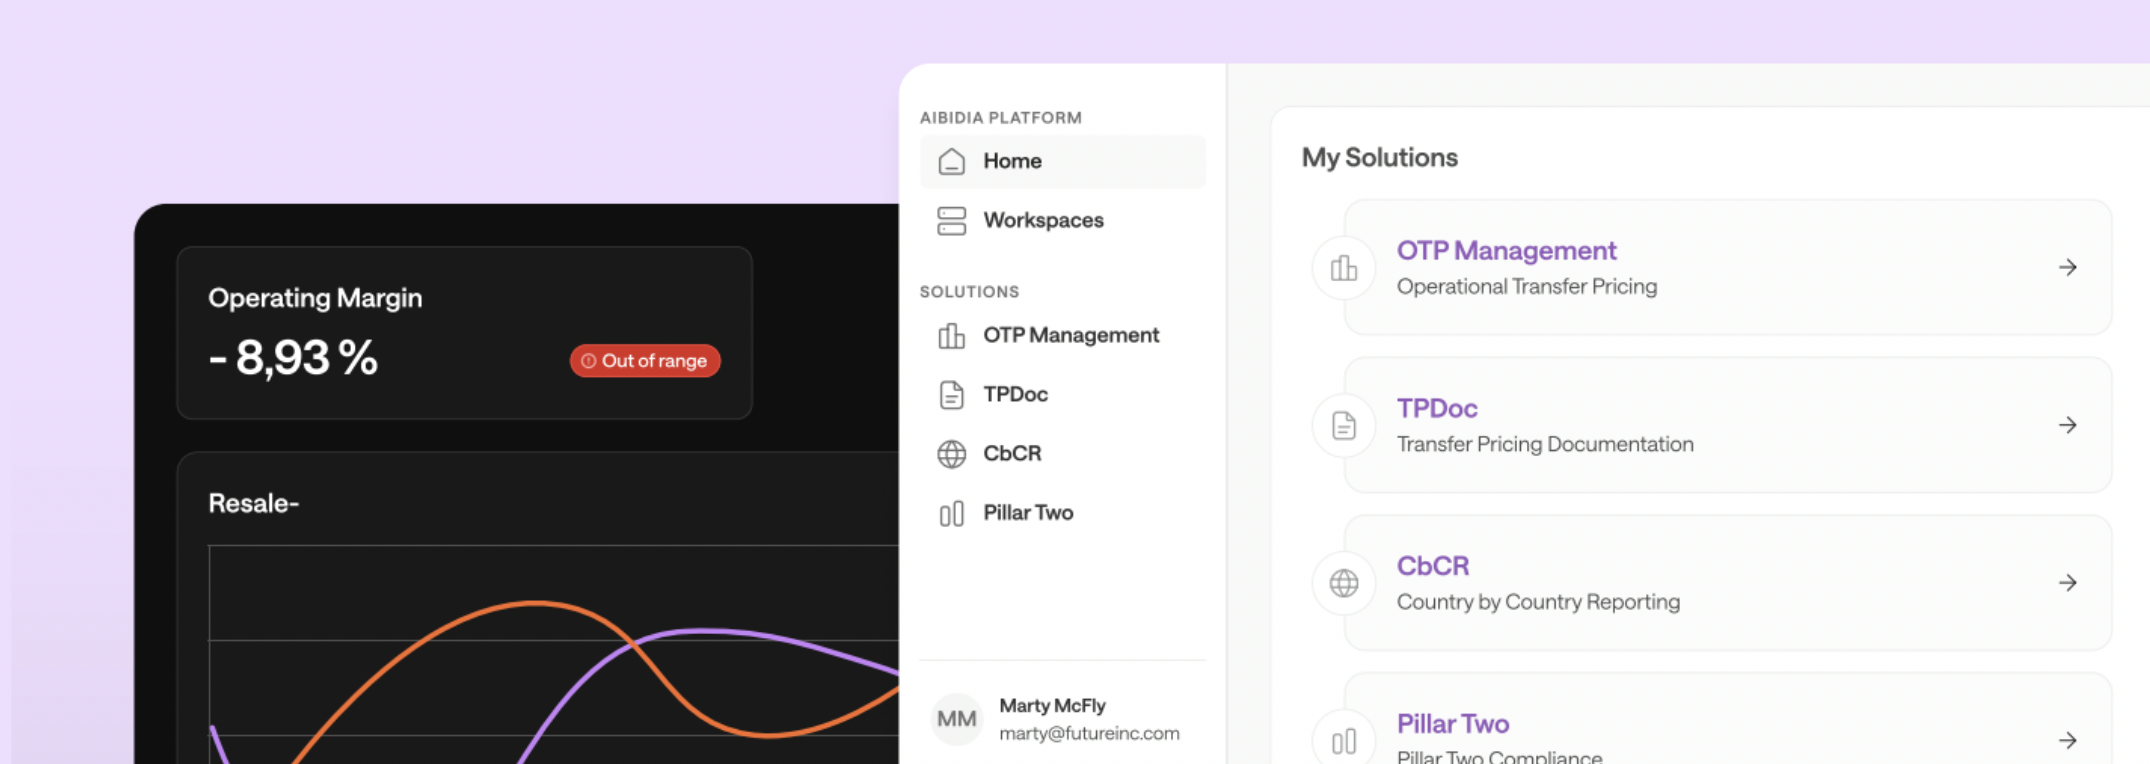
Aibidia connects segmented profit and loss data, benchmarking results, and documentation in one place, so transfer pricing teams see margin positions as they develop rather than at year-end.
What are common challenges when applying TNMM?
- Identifying suitable comparables in industries or jurisdictions with limited data.
- Adjusting for material differences in market conditions or operating structure without overreaching into subjective territory.
- Applying the method consistently across multiple jurisdictions that may interpret the OECD Guidelines differently, or apply divergent rules for range construction, as the OECD/US comparison above illustrates.